
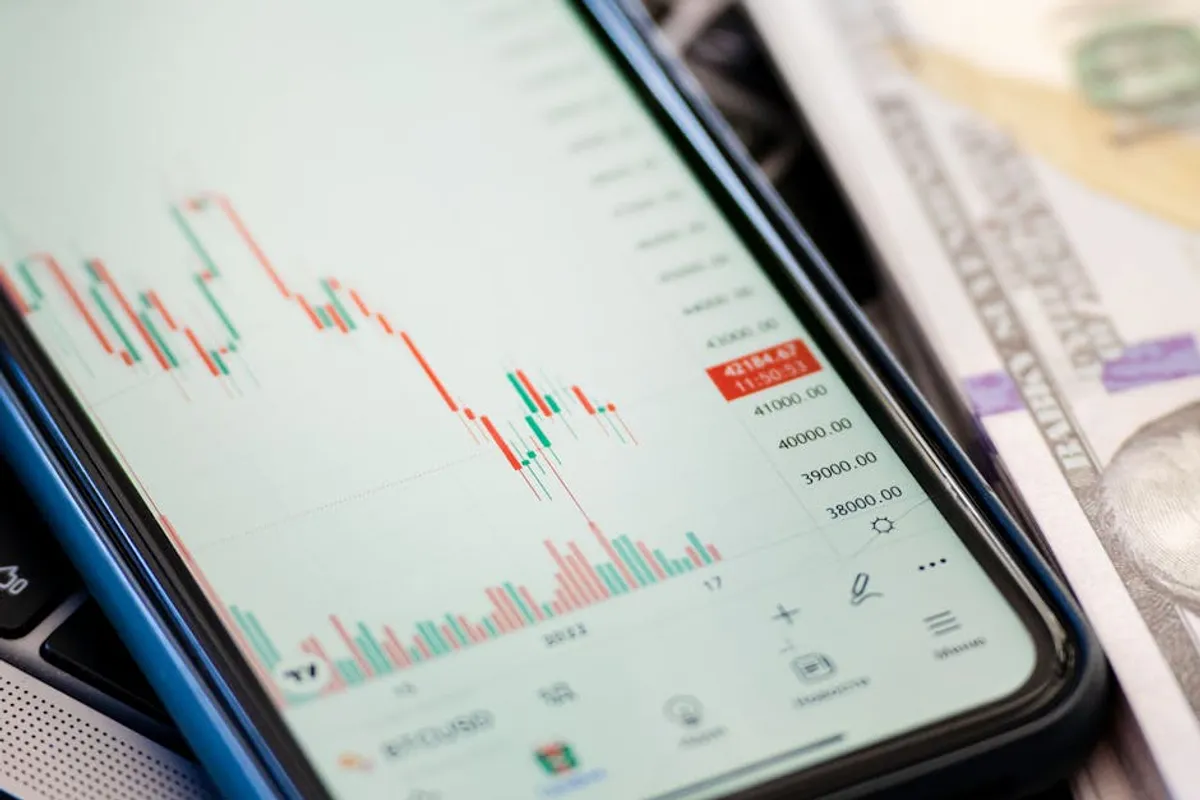
The FTSE 100 index serves as a primary benchmark for the performance of the UK's largest publicly traded companies. For investors, financial analysts, and businesses with exposure to the British economy, understanding its current price, future outlook, inherent risks, and observable market signals is fundamental. This index reflects not just corporate health but also broader economic sentiment, currency movements, and global trade dynamics. Evaluating these components provides a framework for strategic financial planning and investment decisions, offering insights into potential opportunities and necessary precautions within the UK market. Understanding the dynamics of the FTSE 100 index provides crucial context for navigating the broader investment landscape.
Understanding FTSE 100 Pricing Dynamics
The FTSE 100's price represents the aggregate market capitalization of its 100 constituent companies, weighted by their market value. This means larger companies exert a greater influence on the index's movement. Daily price fluctuations are driven by a complex interplay of company-specific news, sector performance, and macroeconomic data releases. For instance, a strong earnings report from a heavily weighted company like AstraZeneca or Shell can significantly impact the index, as can broader economic indicators such as inflation rates, unemployment figures, and GDP growth.
Monitoring the index's real-time price provides an immediate snapshot of market sentiment. However, true understanding requires looking beyond the intraday movements to the underlying drivers. These include analyst revisions to earnings forecasts, dividend expectations, and mergers and acquisitions activity within the constituent companies. Currency strength, particularly the British Pound against the US Dollar and Euro, also plays a role, given the international earnings exposure of many FTSE 100 firms.
Key Price Drivers
Several factors consistently influence the FTSE 100's price:
- Corporate Earnings: Positive or negative surprises from constituent companies directly affect their share prices and, by extension, the index.
- Interest Rate Decisions: The Bank of England's monetary policy announcements impact borrowing costs, consumer spending, and corporate profitability, influencing equity valuations.
- Commodity Prices: A significant portion of the FTSE 100 comprises companies in the energy and mining sectors, making their performance sensitive to global commodity price movements.
- Geopolitical Events: International conflicts, trade disputes, and political instability can introduce volatility and shift investor confidence, affecting capital flows into UK equities.
- Exchange Rates: A weaker pound can boost the value of overseas earnings for multinational FTSE 100 companies when repatriated, potentially supporting the index.
FTSE 100 Outlook: Short-Term and Long-Term Projections
Forecasting the FTSE 100's trajectory involves analyzing both technical patterns and fundamental economic data. Short-term outlooks often rely on momentum indicators, trading volumes, and support/resistance levels, reflecting immediate market sentiment. Long-term projections, conversely, are typically built upon macroeconomic forecasts, corporate earnings growth expectations, and assessments of global economic health.
Analysts frequently use consensus earnings estimates for the constituent companies to project future index levels. Economic models incorporate variables like GDP growth, inflation, and interest rate expectations to build a broader picture. The resilience of consumer spending, business investment trends, and the health of key trading partners are also critical inputs. A robust global economy generally provides a tailwind for the FTSE 100 due to its multinational composition, while slowdowns can present headwinds.
Influential Economic Indicators
Key economic data points that shape the FTSE 100 outlook include:
- Inflation Data (CPI): High inflation can erode corporate profits and consumer purchasing power, potentially leading to interest rate hikes that dampen market enthusiasm.
- GDP Growth: A strong economy generally translates to higher corporate revenues and profits, supporting equity valuations.
- Purchasing Managers' Index (PMI): These surveys provide a forward-looking indicator of economic activity in manufacturing and services sectors.
- Consumer Confidence: Reflects household spending intentions, a significant driver of economic growth.
- Unemployment Rates: Low unemployment often signals a healthy economy, but can also lead to wage inflation, impacting corporate costs.
Identifying and Mitigating FTSE 100 Risks
Investing or operating with exposure to the FTSE 100 involves navigating a range of risks, which can be broadly categorized as systemic and idiosyncratic. Systemic risks affect the entire market, while idiosyncratic risks are specific to individual companies or sectors within the index. Understanding these risks is crucial for developing robust risk management strategies.
Macroeconomic risks, such as unexpected inflation spikes, rapid interest rate increases, or a significant economic recession, can depress company valuations across the board. Geopolitical risks, including international trade wars, energy supply disruptions, or political instability within the UK, can introduce significant uncertainty and volatility. Furthermore, regulatory changes, such as new environmental policies or financial regulations, can impact specific sectors disproportionately.
Pro Tip: When evaluating FTSE 100 exposure, consider the index's sector concentration. A significant weighting towards financial, energy, and materials sectors means the index can be particularly sensitive to global commodity prices, banking regulations, and interest rate movements. Diversifying across different asset classes or geographies can help mitigate concentration risk specific to the UK market.
Interpreting Market Signals from the FTSE 100
The FTSE 100 generates numerous market signals that, when interpreted correctly, can inform strategic decisions. Beyond simple price movements, these signals include trading volume, volatility metrics, and the performance of specific sectors or key constituents. High trading volumes accompanying significant price changes often indicate strong conviction behind the move, whether up or down.
Volatility, often measured by indices like the VIX (though a US index, the concept of market fear applies broadly), suggests investor uncertainty and can precede sharp market corrections or reversals. Analyzing the performance of different sectors within the FTSE 100 can also reveal shifts in economic leadership. For example, outperformance by defensive sectors (e.g., consumer staples, healthcare) during a period of overall market weakness might signal investor caution, while leadership from cyclical sectors (e.g., industrials, financials) could indicate growing economic optimism.
Leading vs. Lagging Indicators
Distinguishing between leading and lagging indicators is vital:
- Leading Indicators: These attempt to predict future market movements. Examples include new orders for durable goods, building permits, and consumer confidence surveys.
- Lagging Indicators: These confirm past trends. Examples include unemployment rates, corporate profits, and inflation rates. While they don't predict, they confirm the direction of the economy.
- Coincident Indicators: These move in conjunction with the market or economy. Examples include industrial production and personal income.
Monitoring the relationship between these types of indicators provides a more holistic view of the market's current state and potential future direction, allowing for more informed decision-making.
Strategic Considerations for FTSE 100 Engagement
Engaging with the FTSE 100, whether as an investor, a business leader assessing economic climate, or a market analyst, demands a structured approach. Focus on synthesizing the current price, the prevailing outlook, identified risks, and deciphered market signals into a coherent strategic framework. Recognize that the FTSE 100 is not a monolithic entity but a dynamic representation of diverse industries and global economic forces.
For investors, this means aligning portfolio allocations with the long-term outlook while being prepared to adjust for short-term risks indicated by market signals. For businesses, understanding the index's trajectory can inform decisions on capital expenditure, expansion plans, and risk hedging. Continuous monitoring and a disciplined approach to data interpretation are paramount to leveraging the FTSE 100 as a valuable indicator of economic health and investment opportunity.
Frequently Asked Questions
What is the FTSE 100?
The FTSE 100, or Financial Times Stock Exchange 100 Index, is a share index of the 100 companies listed on the London Stock Exchange with the highest market capitalization. It is widely regarded as a benchmark for the performance of the UK stock market and the broader UK economy.
How often is the FTSE 100 rebalanced?
The FTSE 100 is typically rebalanced quarterly, in March, June, September, and December. During these reviews, companies may be added to or removed from the index based on their market capitalization and other eligibility criteria, ensuring it remains representative of the largest UK-listed firms.
What are the primary factors driving FTSE 100 performance?
Key drivers include corporate earnings reports, macroeconomic indicators such as GDP growth and inflation, interest rate decisions by the Bank of England, global commodity prices, and significant geopolitical events. The international exposure of many FTSE 100 companies also makes exchange rate fluctuations influential.
How can one track FTSE 100 market signals?
Tracking involves monitoring real-time price charts, trading volumes, sector performance, and volatility indices. Additionally, following economic calendars for key data releases (e.g., CPI, GDP, PMI), analyst reports, and news related to major constituent companies provides crucial context for interpreting market sentiment and potential future movements.